Trend
Jobs opened and loss-to-invoice cycle by month
Jobs openedLoss → invoice, days
Breakdown
Jobs openedJobsMargin
Claim to cash
Where the days go: loss call to carrier payment
Average days per stage for the selection. Insurance-billed jobs only.
Service territory
Jobs by county across the four-county footprint
Bubble size = jobs opened in the period. Label = jobs · avg cycle days.
What this board answers
Three questions a Controller asks on Monday
Coverage & sources
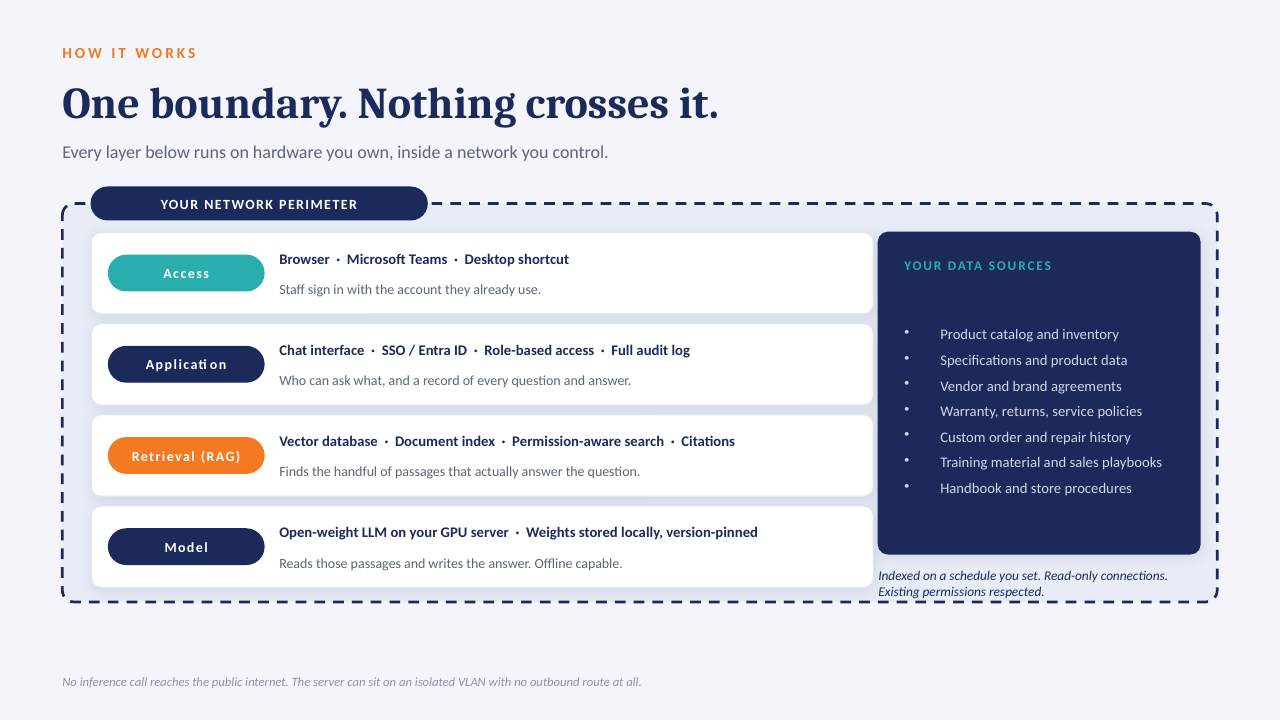
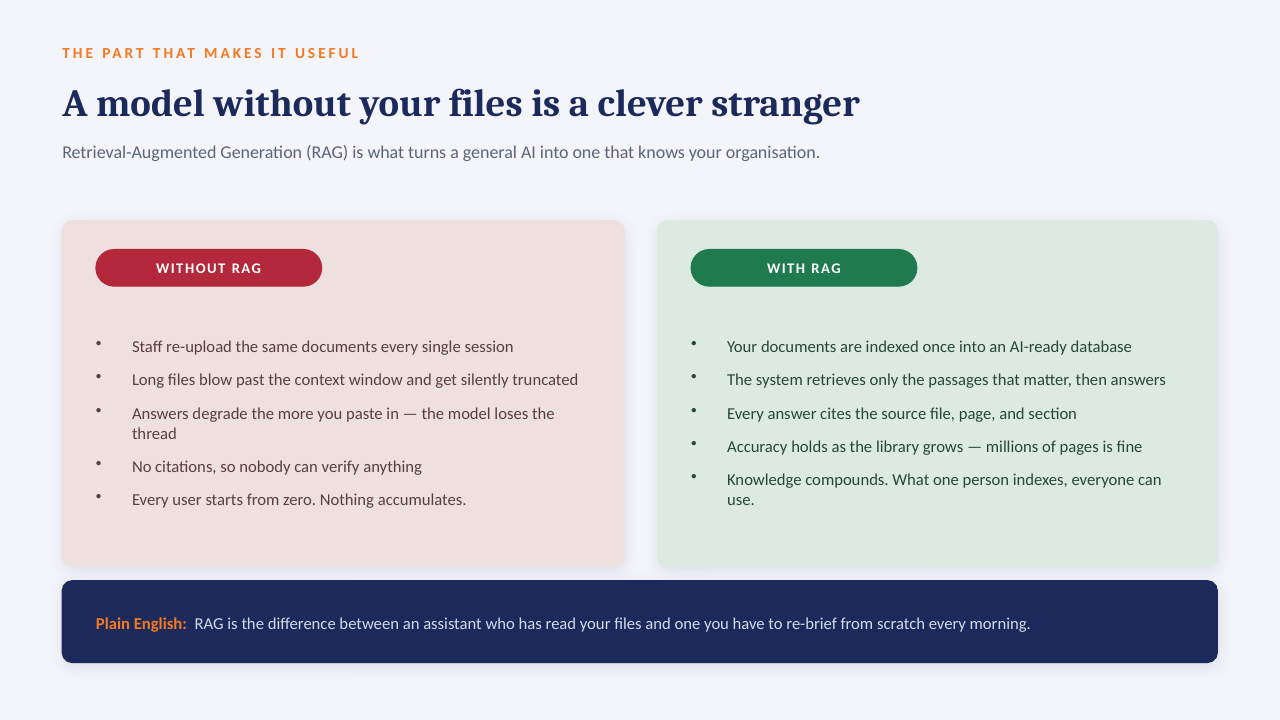
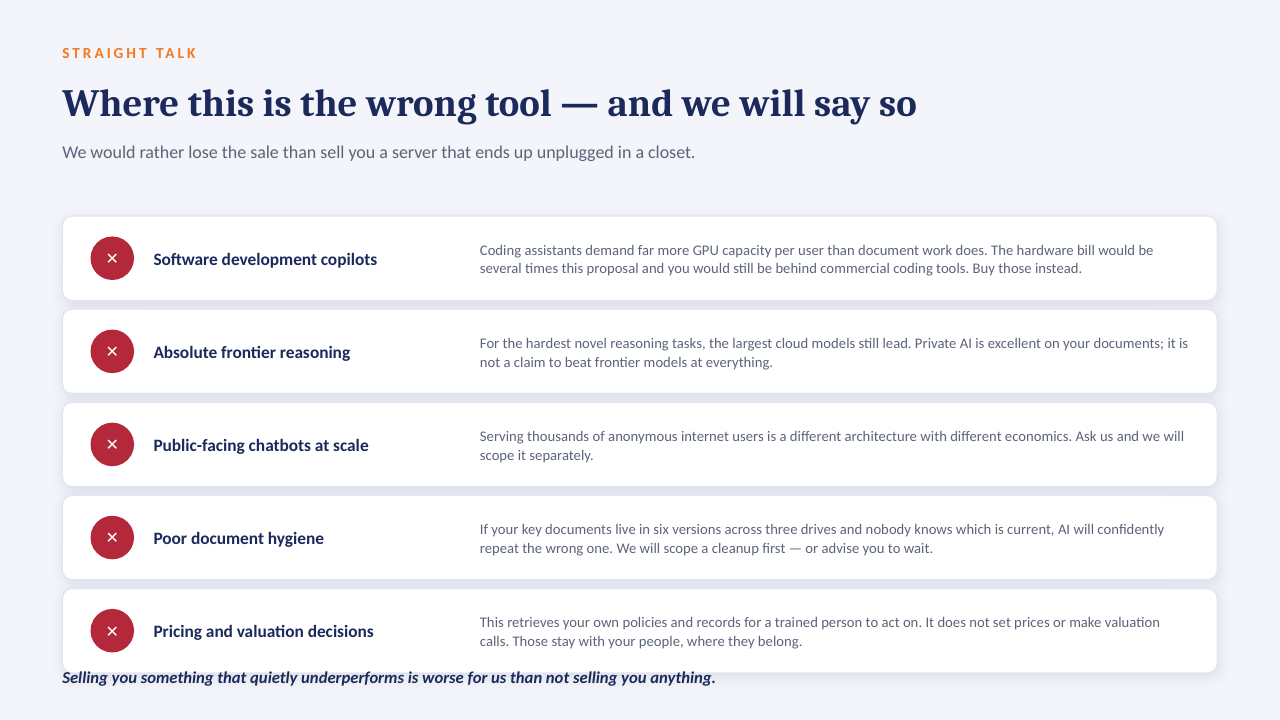
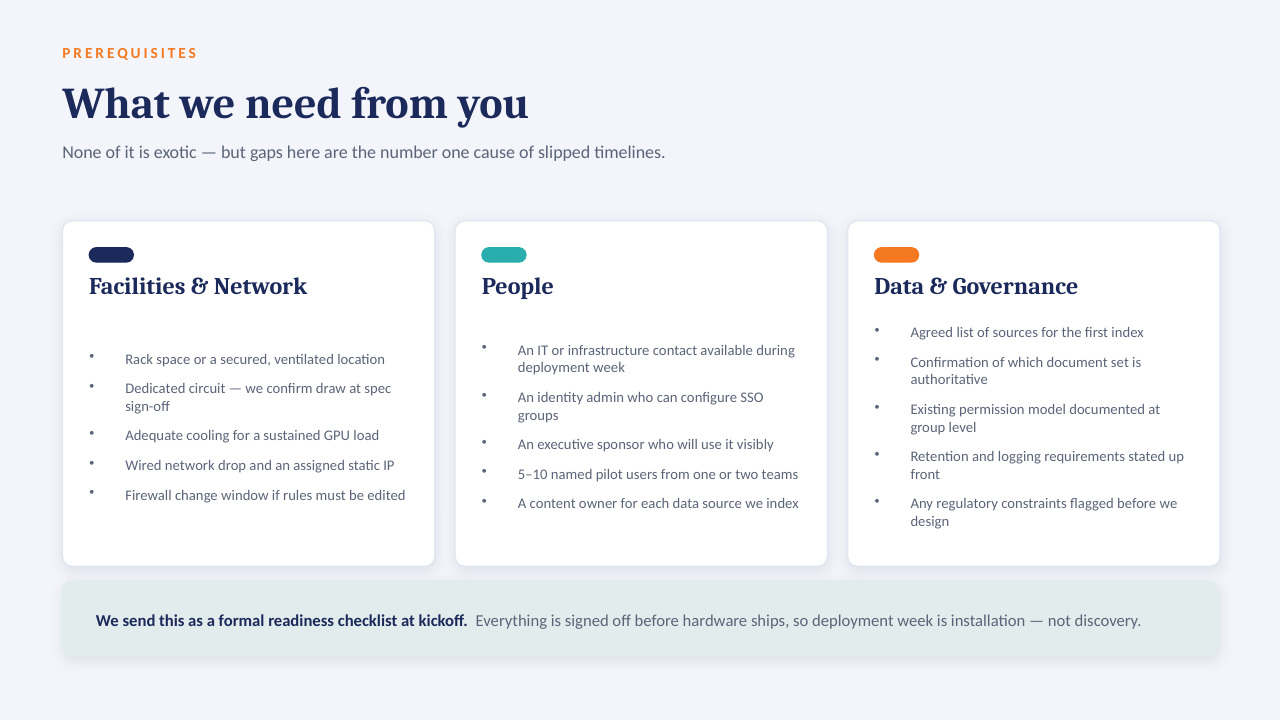
How this is built
1 Cut N Dry serves four Southern California counties (San Bernardino, Riverside, Orange, Los Angeles) and lists 12 service lines on cutndryrestoration.com; the Orange County expansion was announced October 2024. Those are the only real figures on this page: the four counties, the department mix and the 12 service lines shape the model. Every job count, day count and percentage is illustrative and internally consistent (department totals sum to the board total; percentages are job-weighted).
The production version reads the BI export of your job-management system (jobs, estimates, invoices, technician time) into Power BI on a nightly refresh; each department gets its own page with the same filters, and the Controller view rolls them up.
The production version reads the BI export of your job-management system (jobs, estimates, invoices, technician time) into Power BI on a nightly refresh; each department gets its own page with the same filters, and the Controller view rolls them up.